

Environmental Views
Worth a thousand words
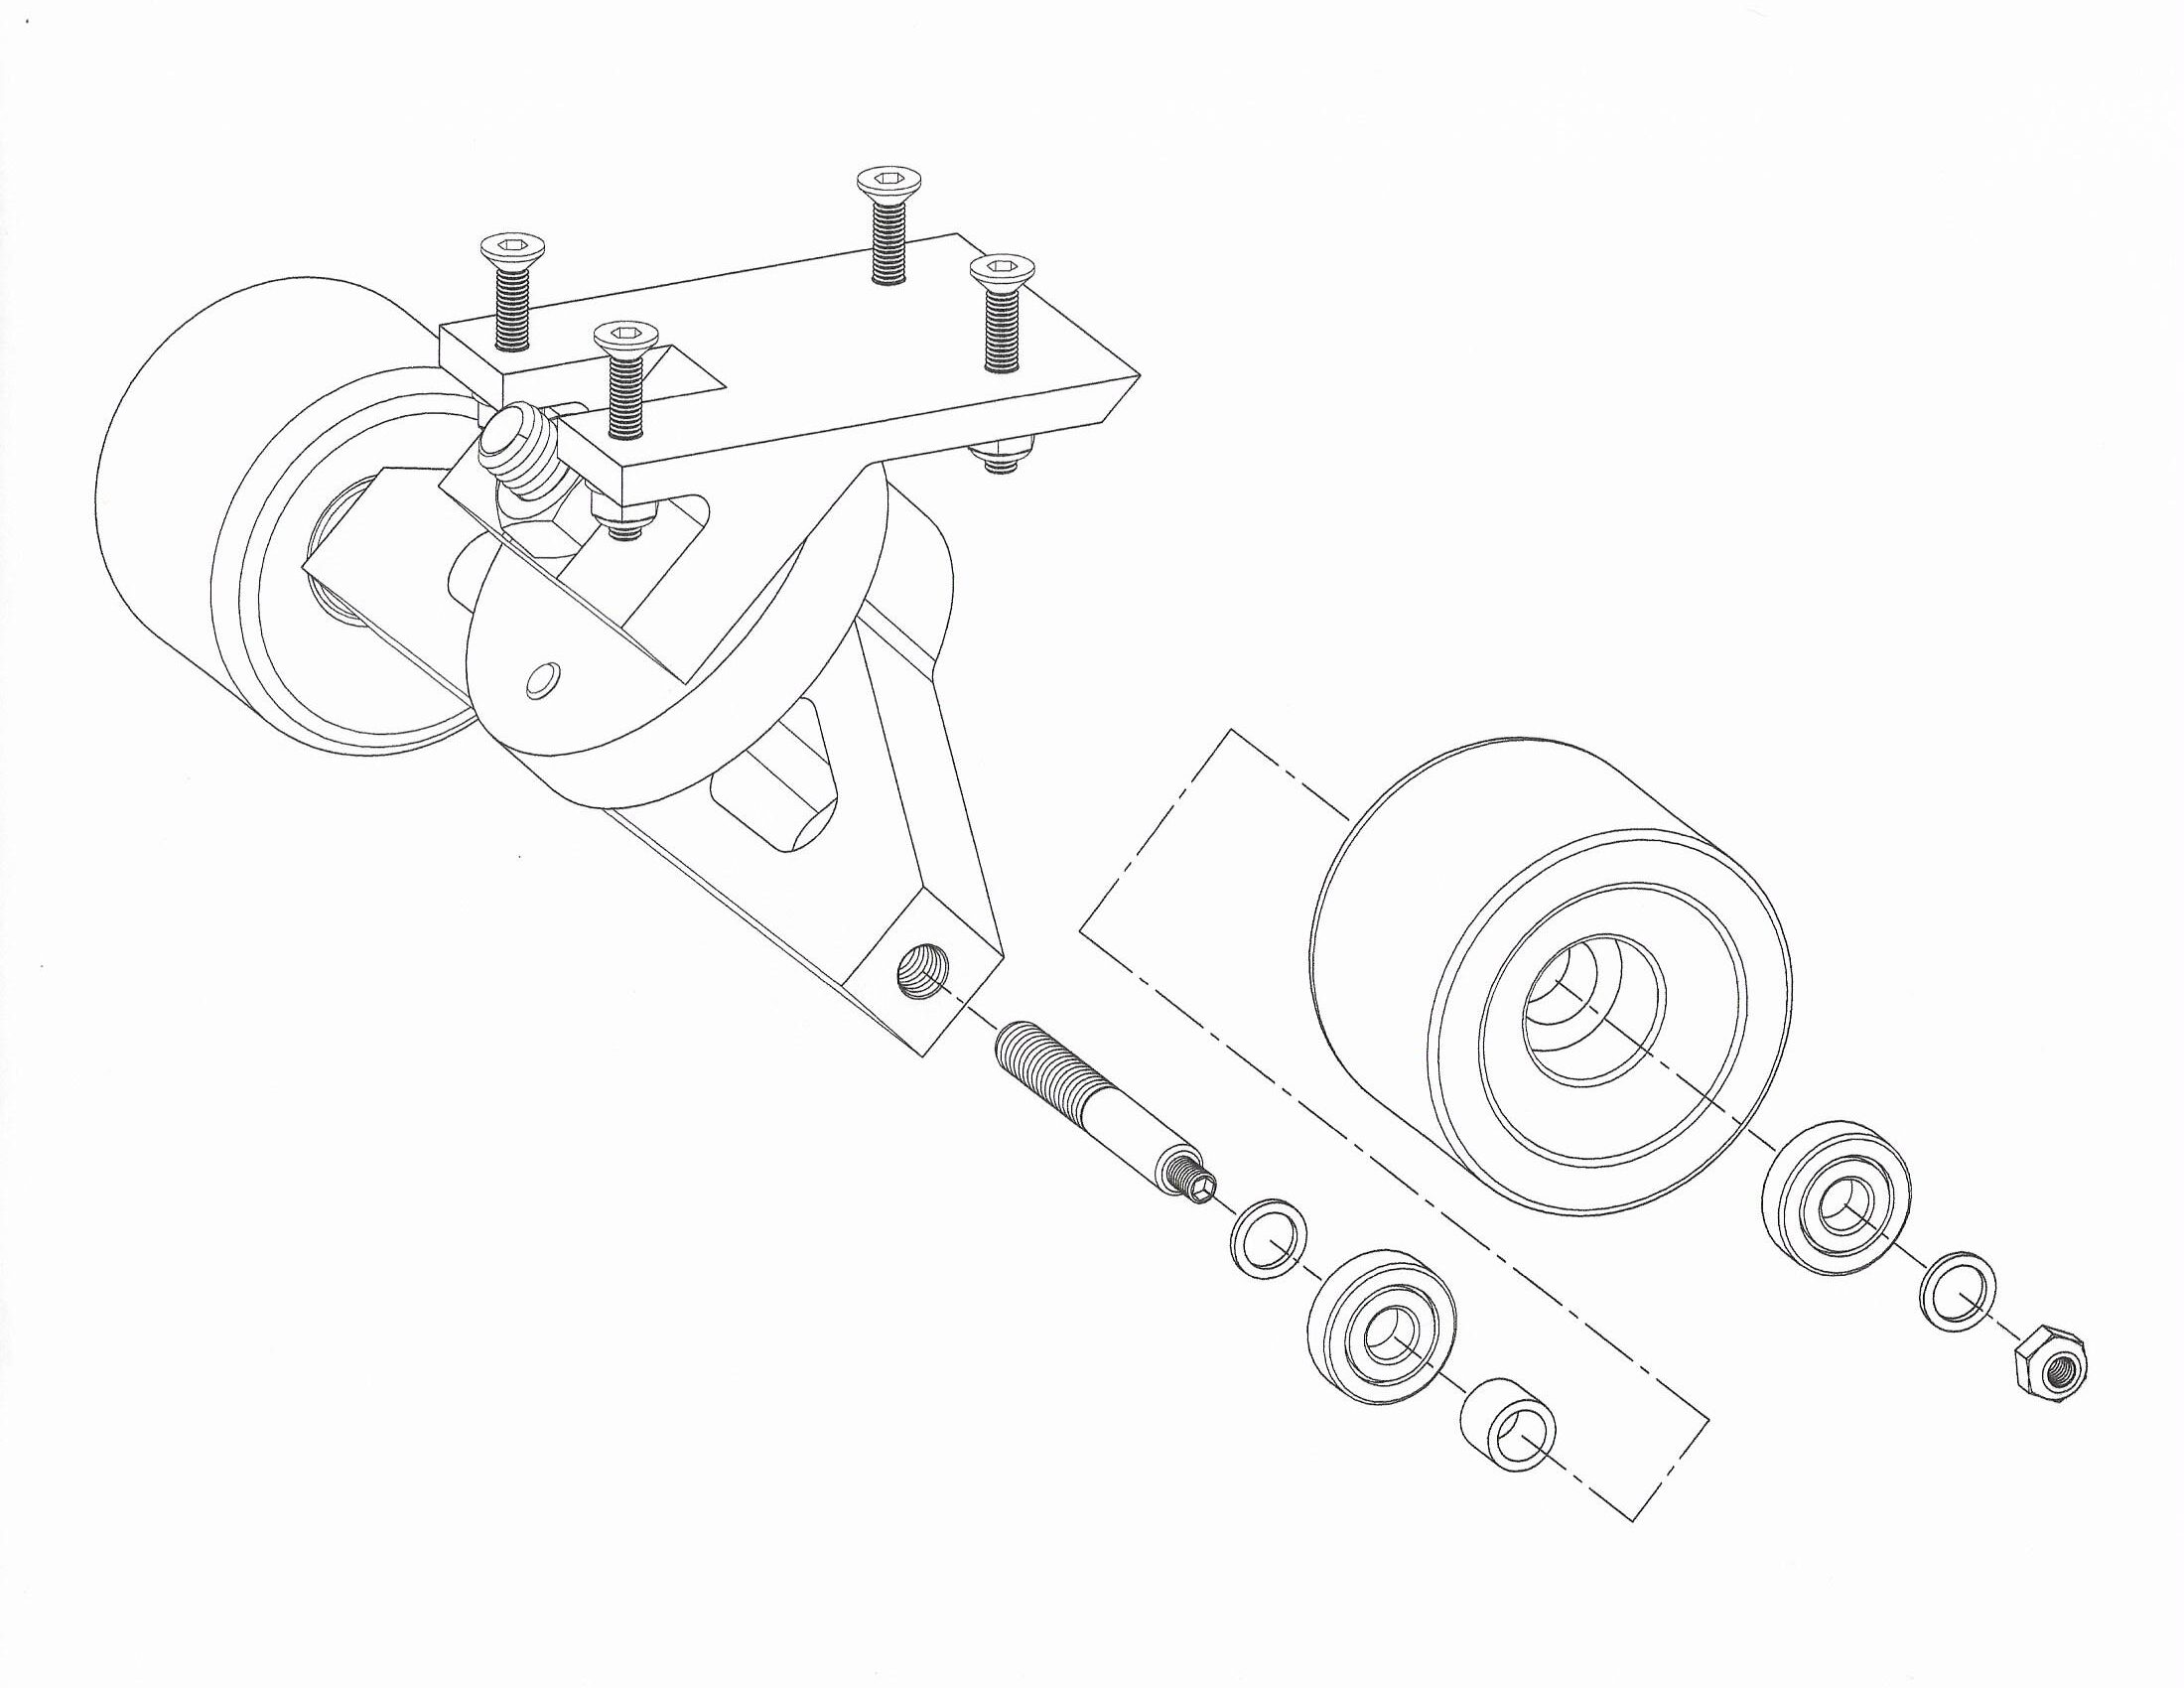
Assembly Views
Also known as Exploded Views
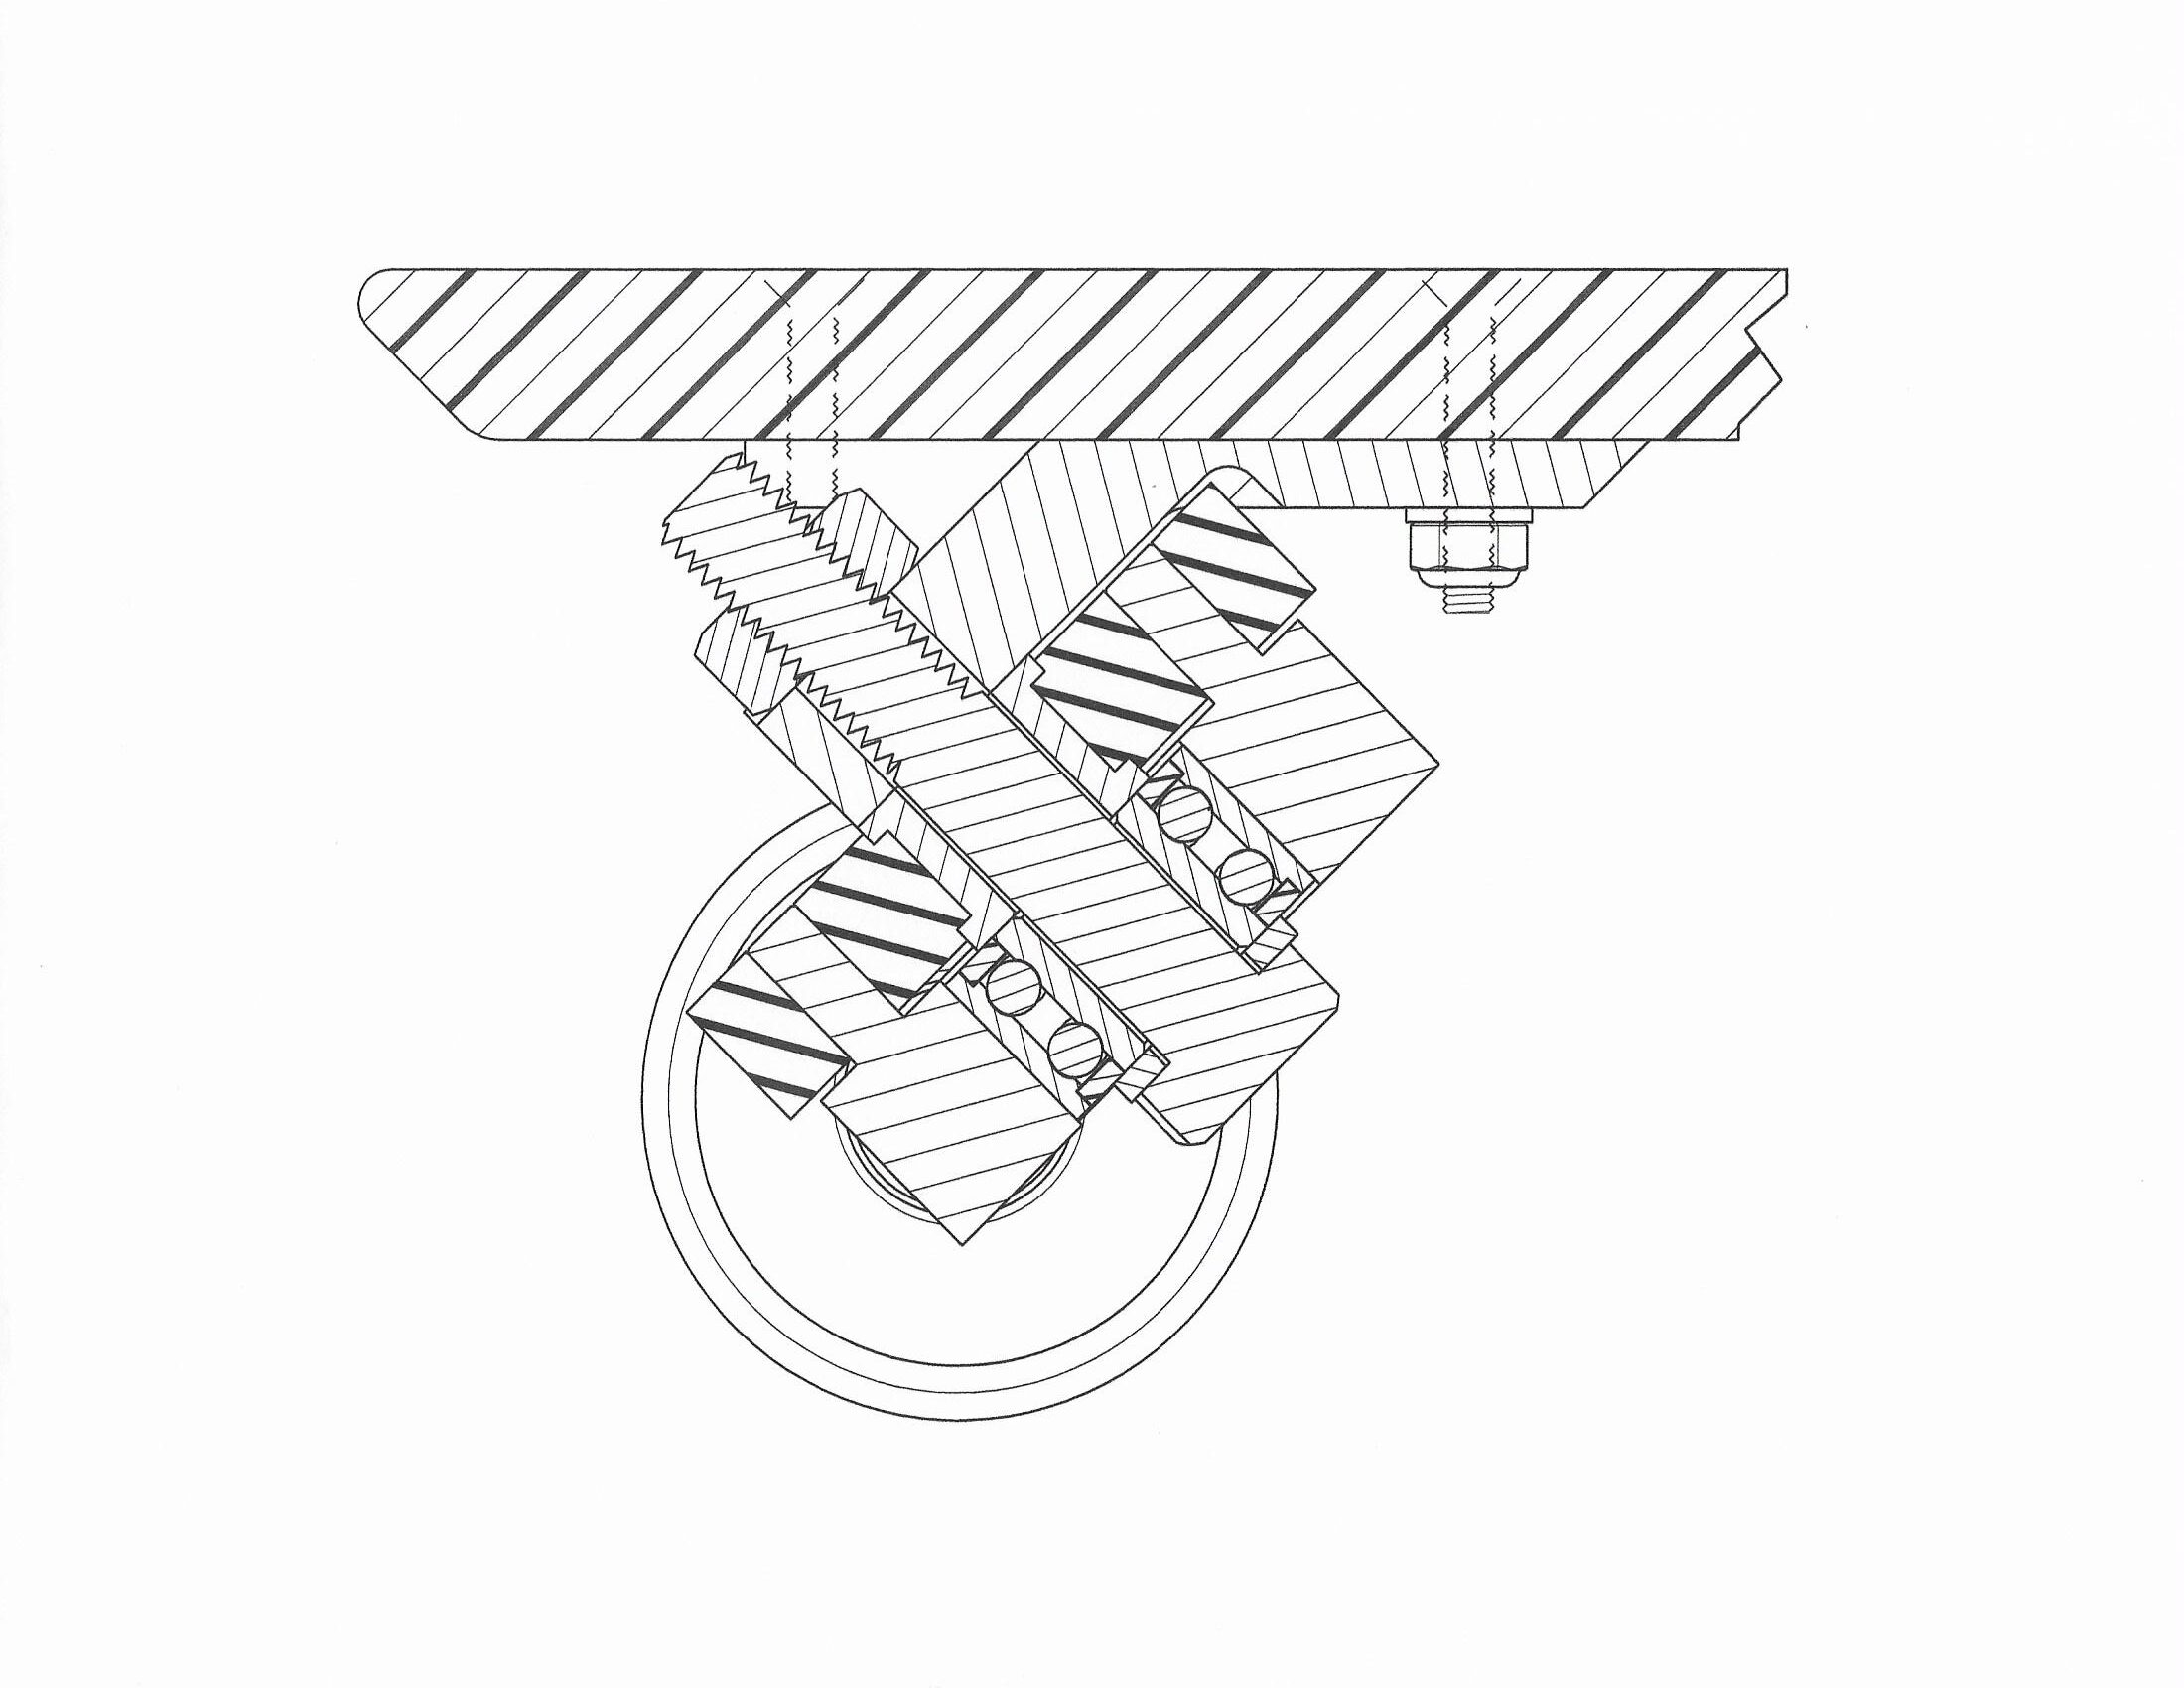
Cross-Section Views
Cutting the item down the middle
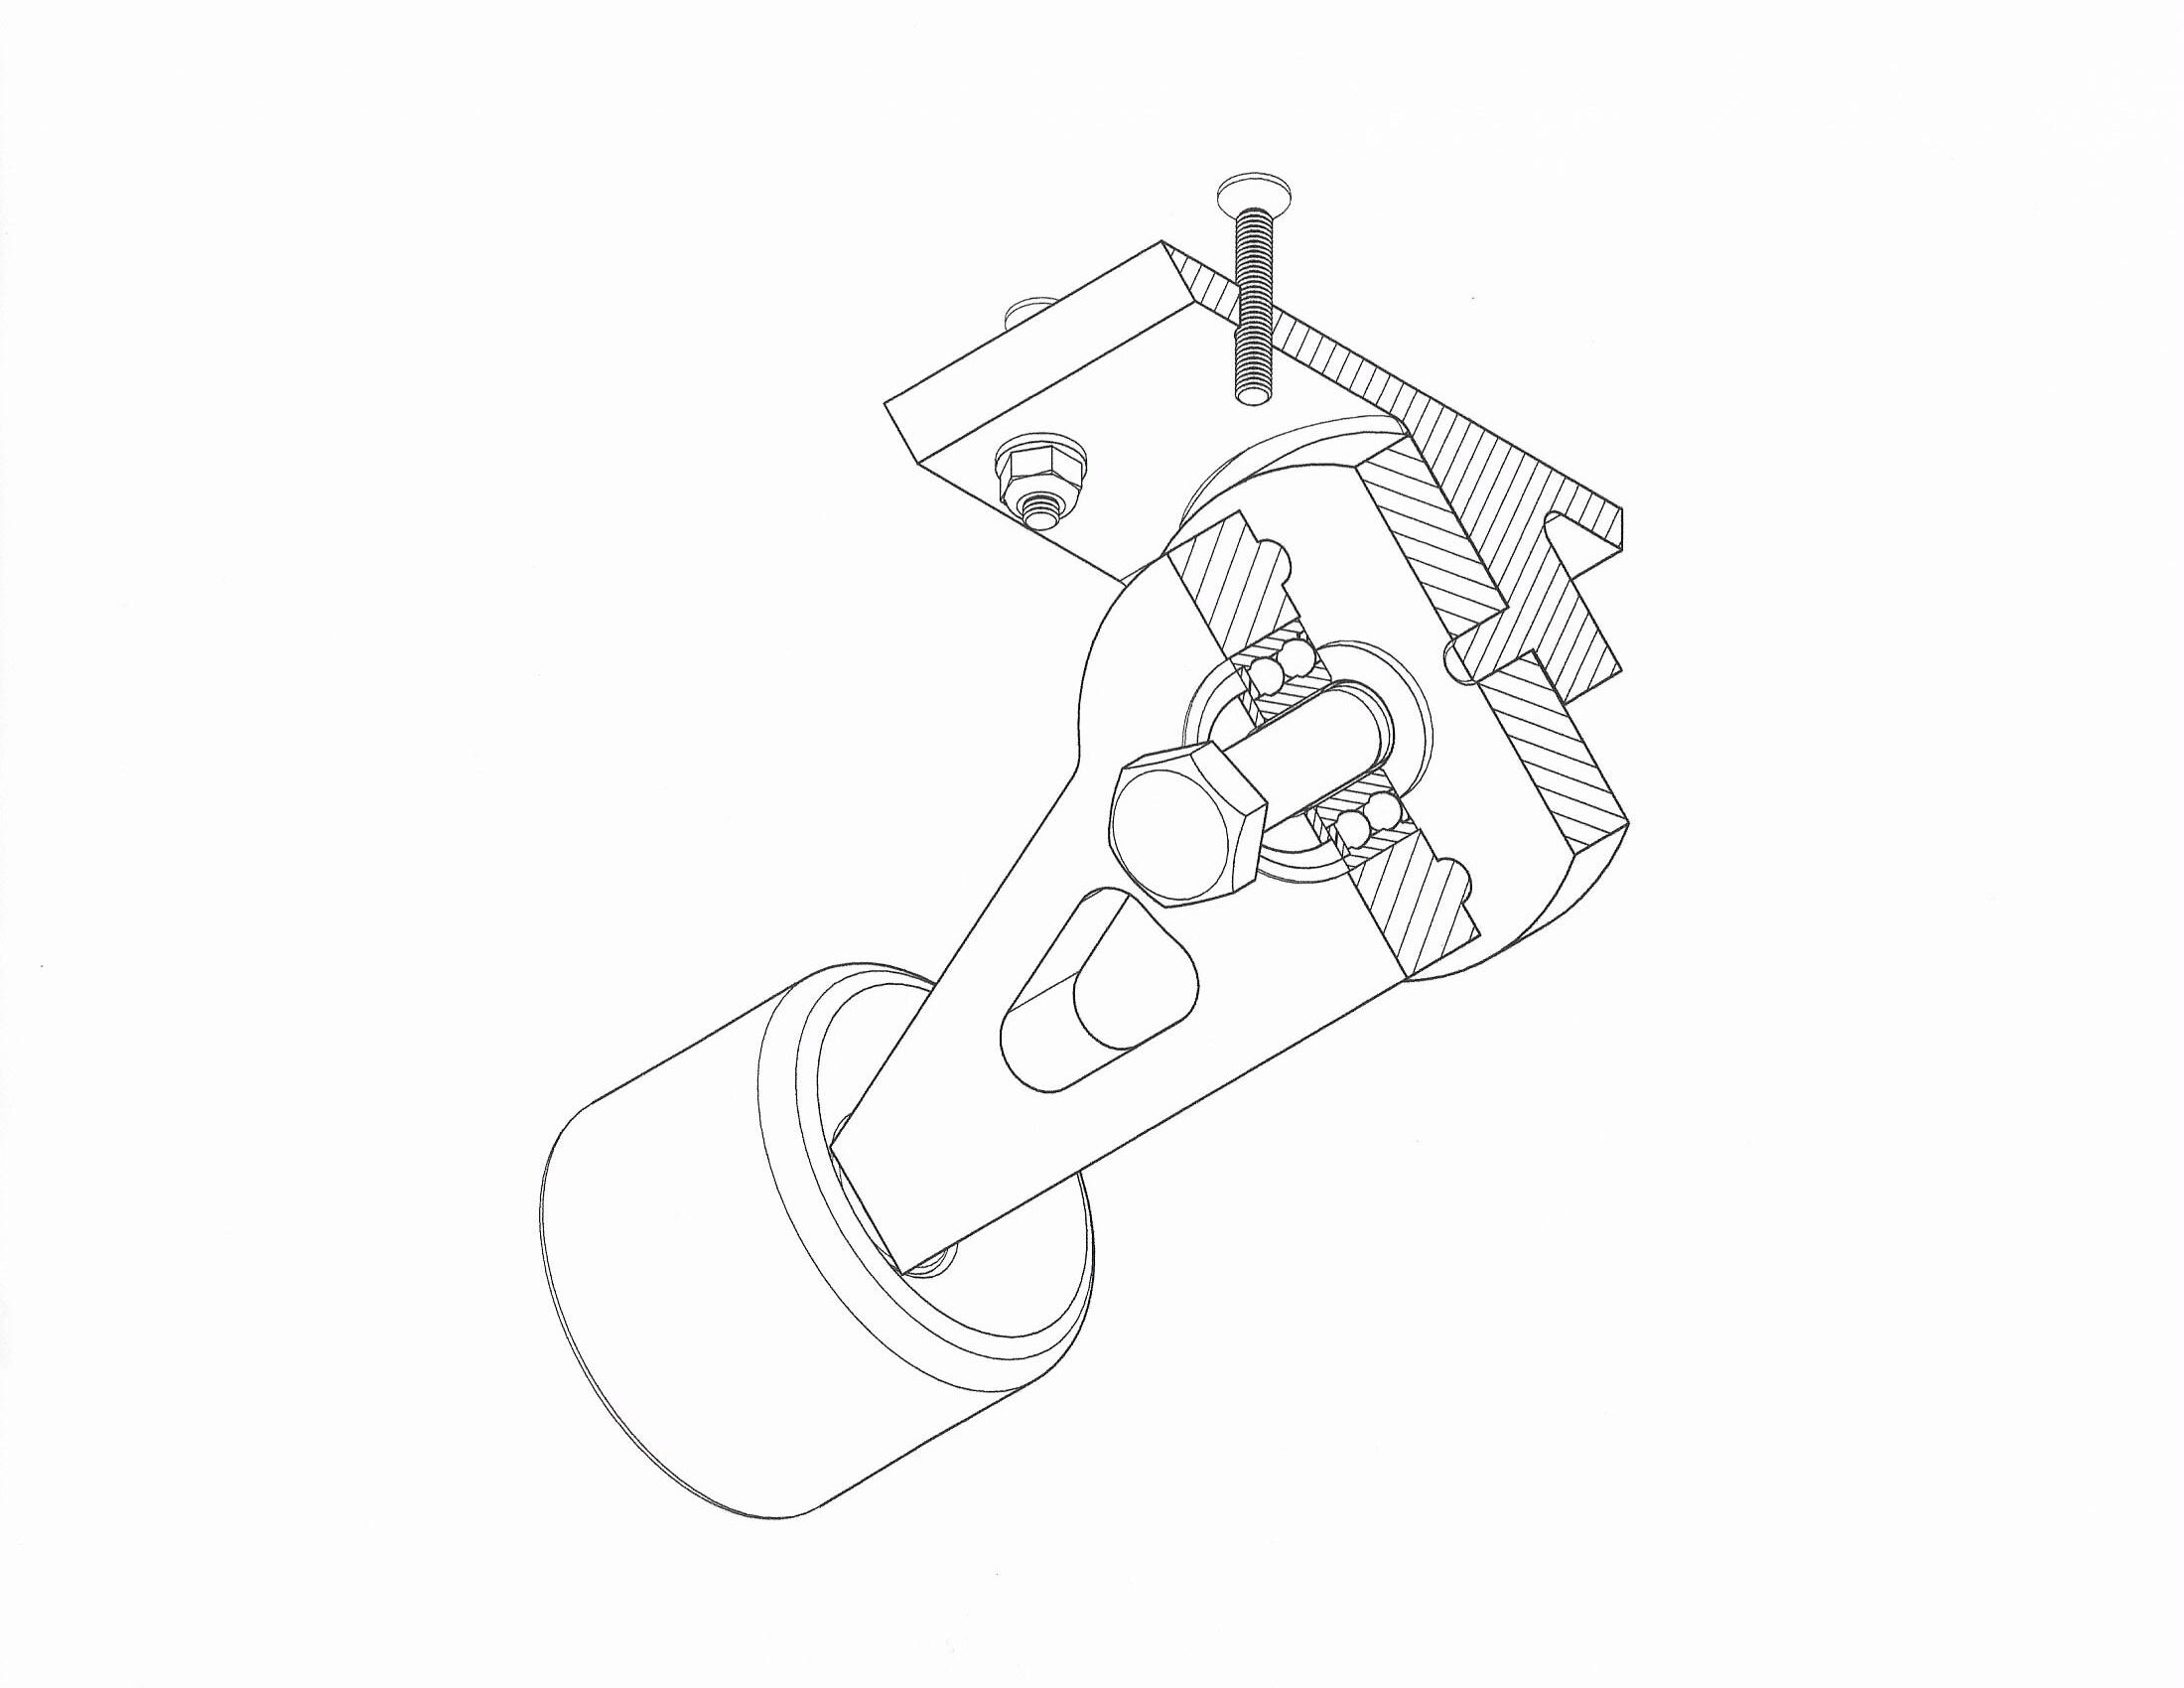
Section Views
Similar to Cross-Section Views
Partial Section Views
Special uses of sectioning

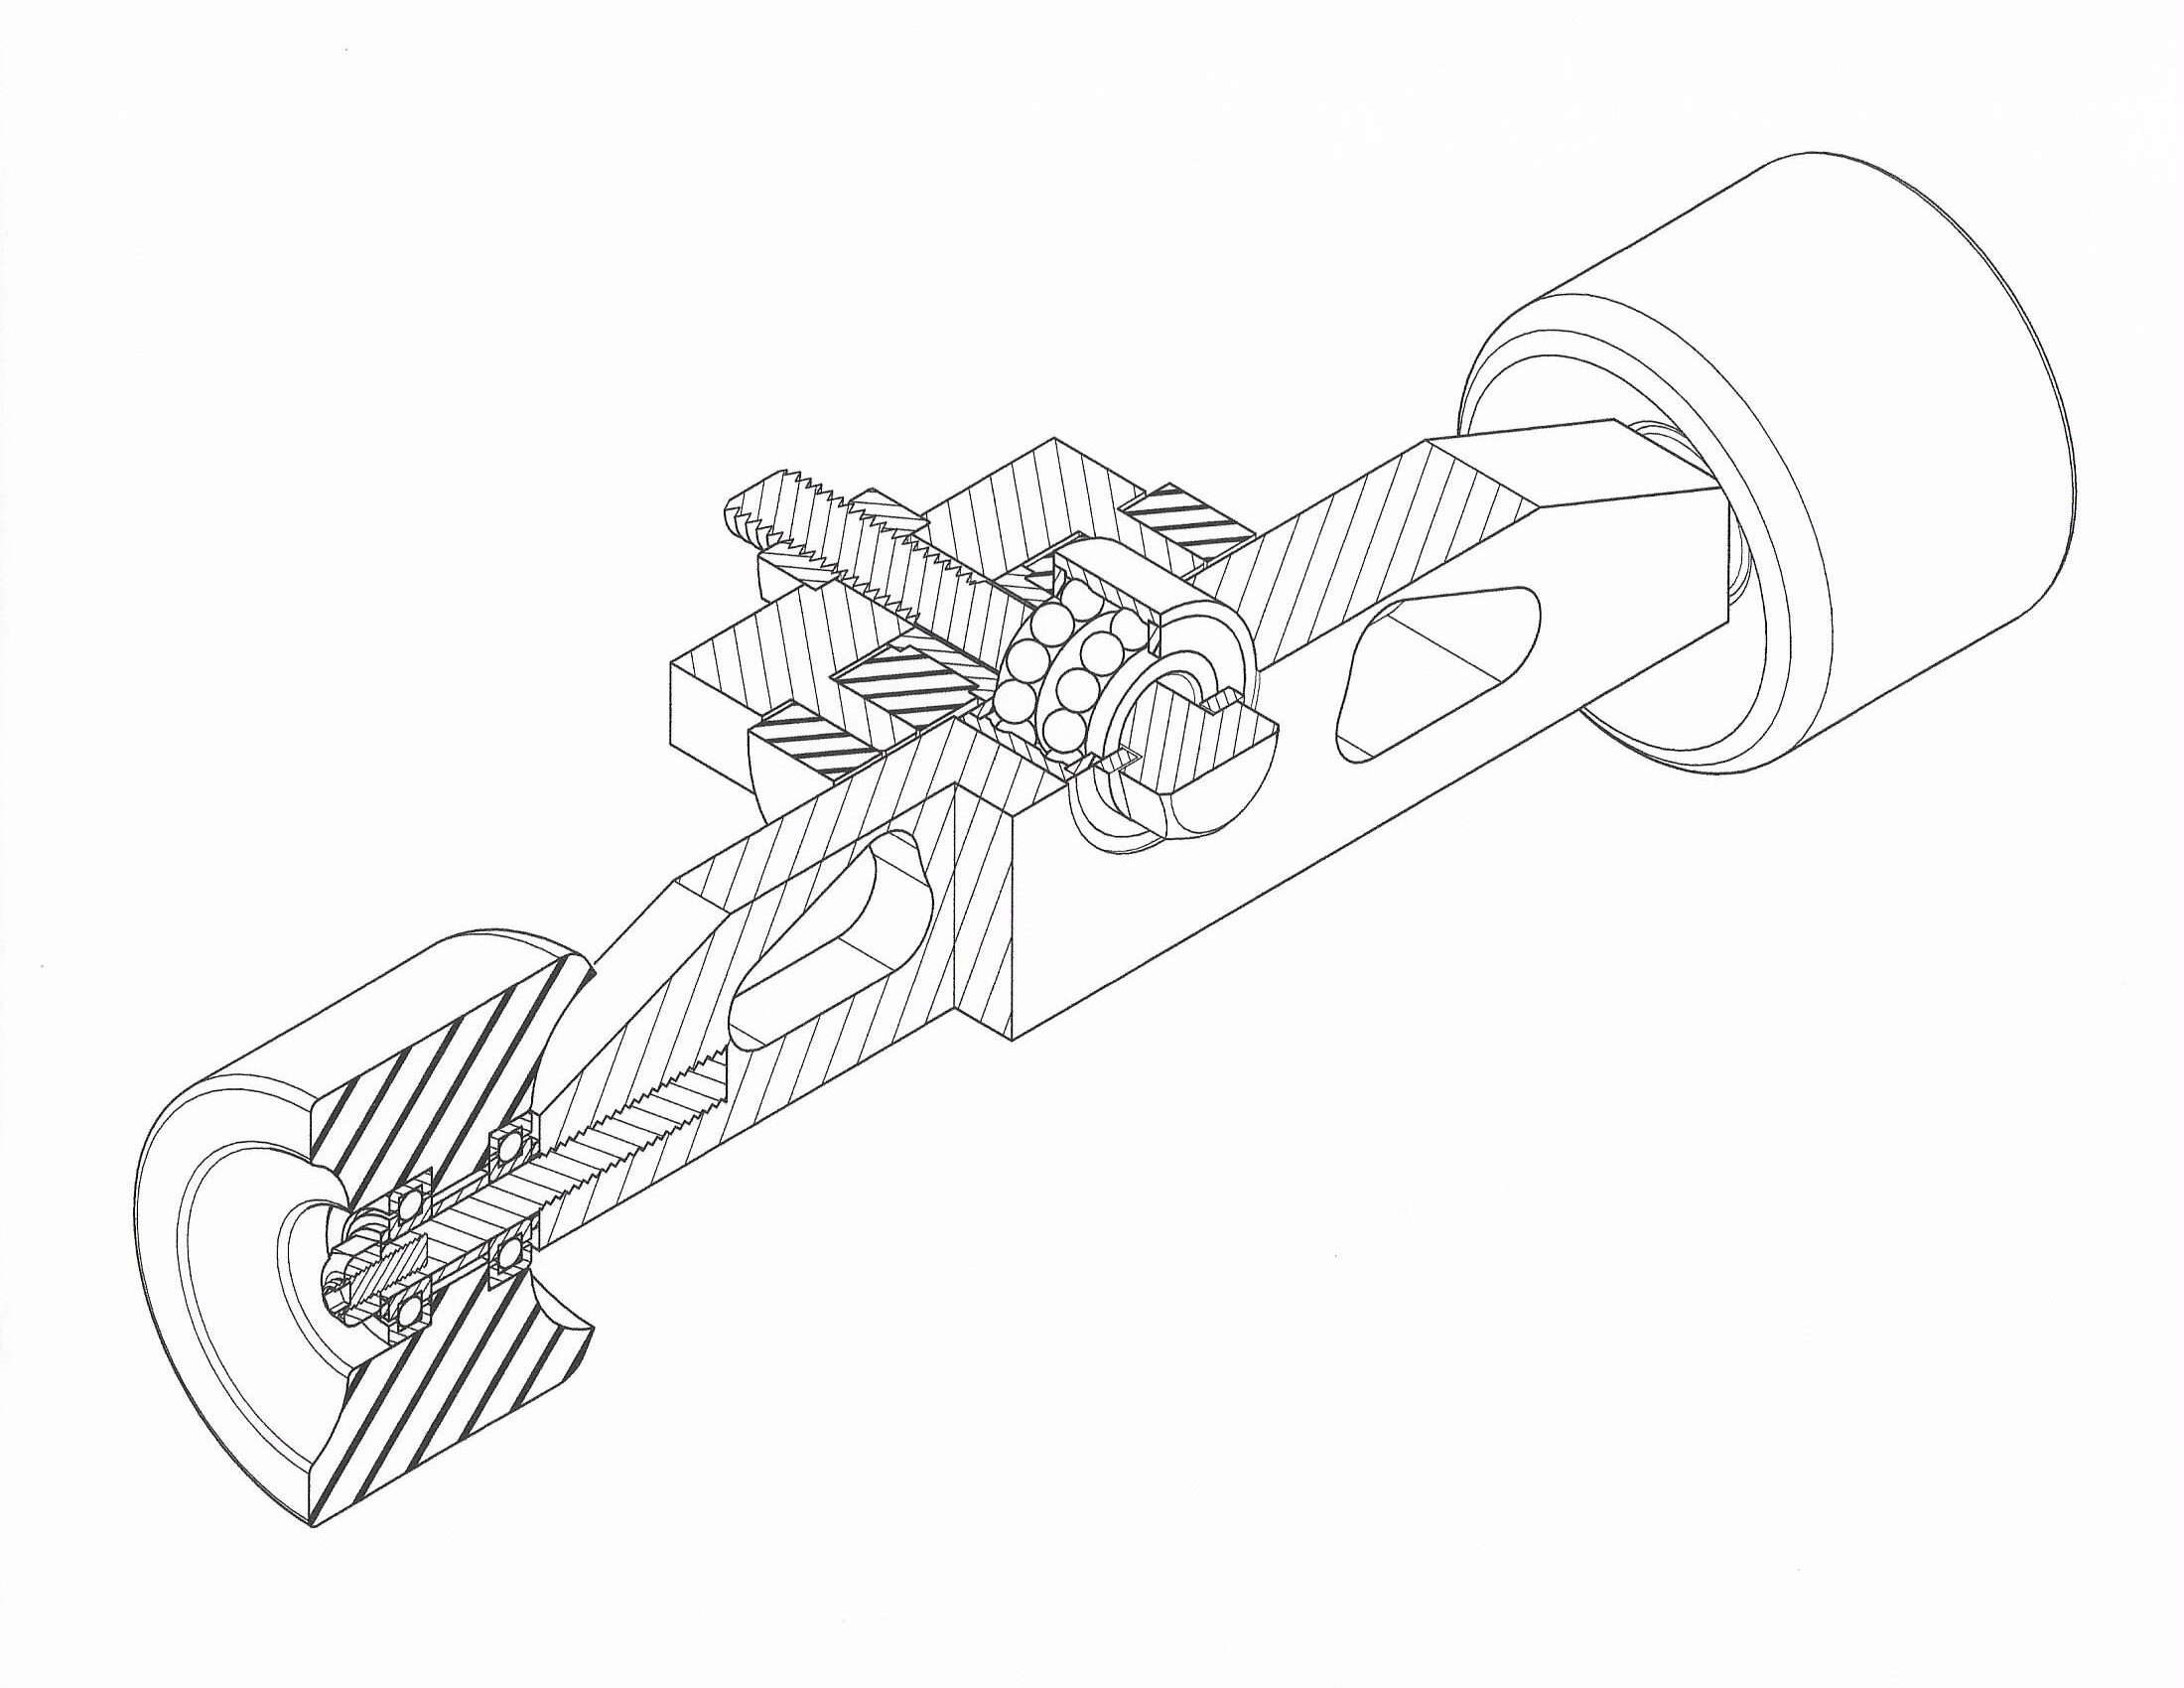
Break-Away Views
Used to see interior parts
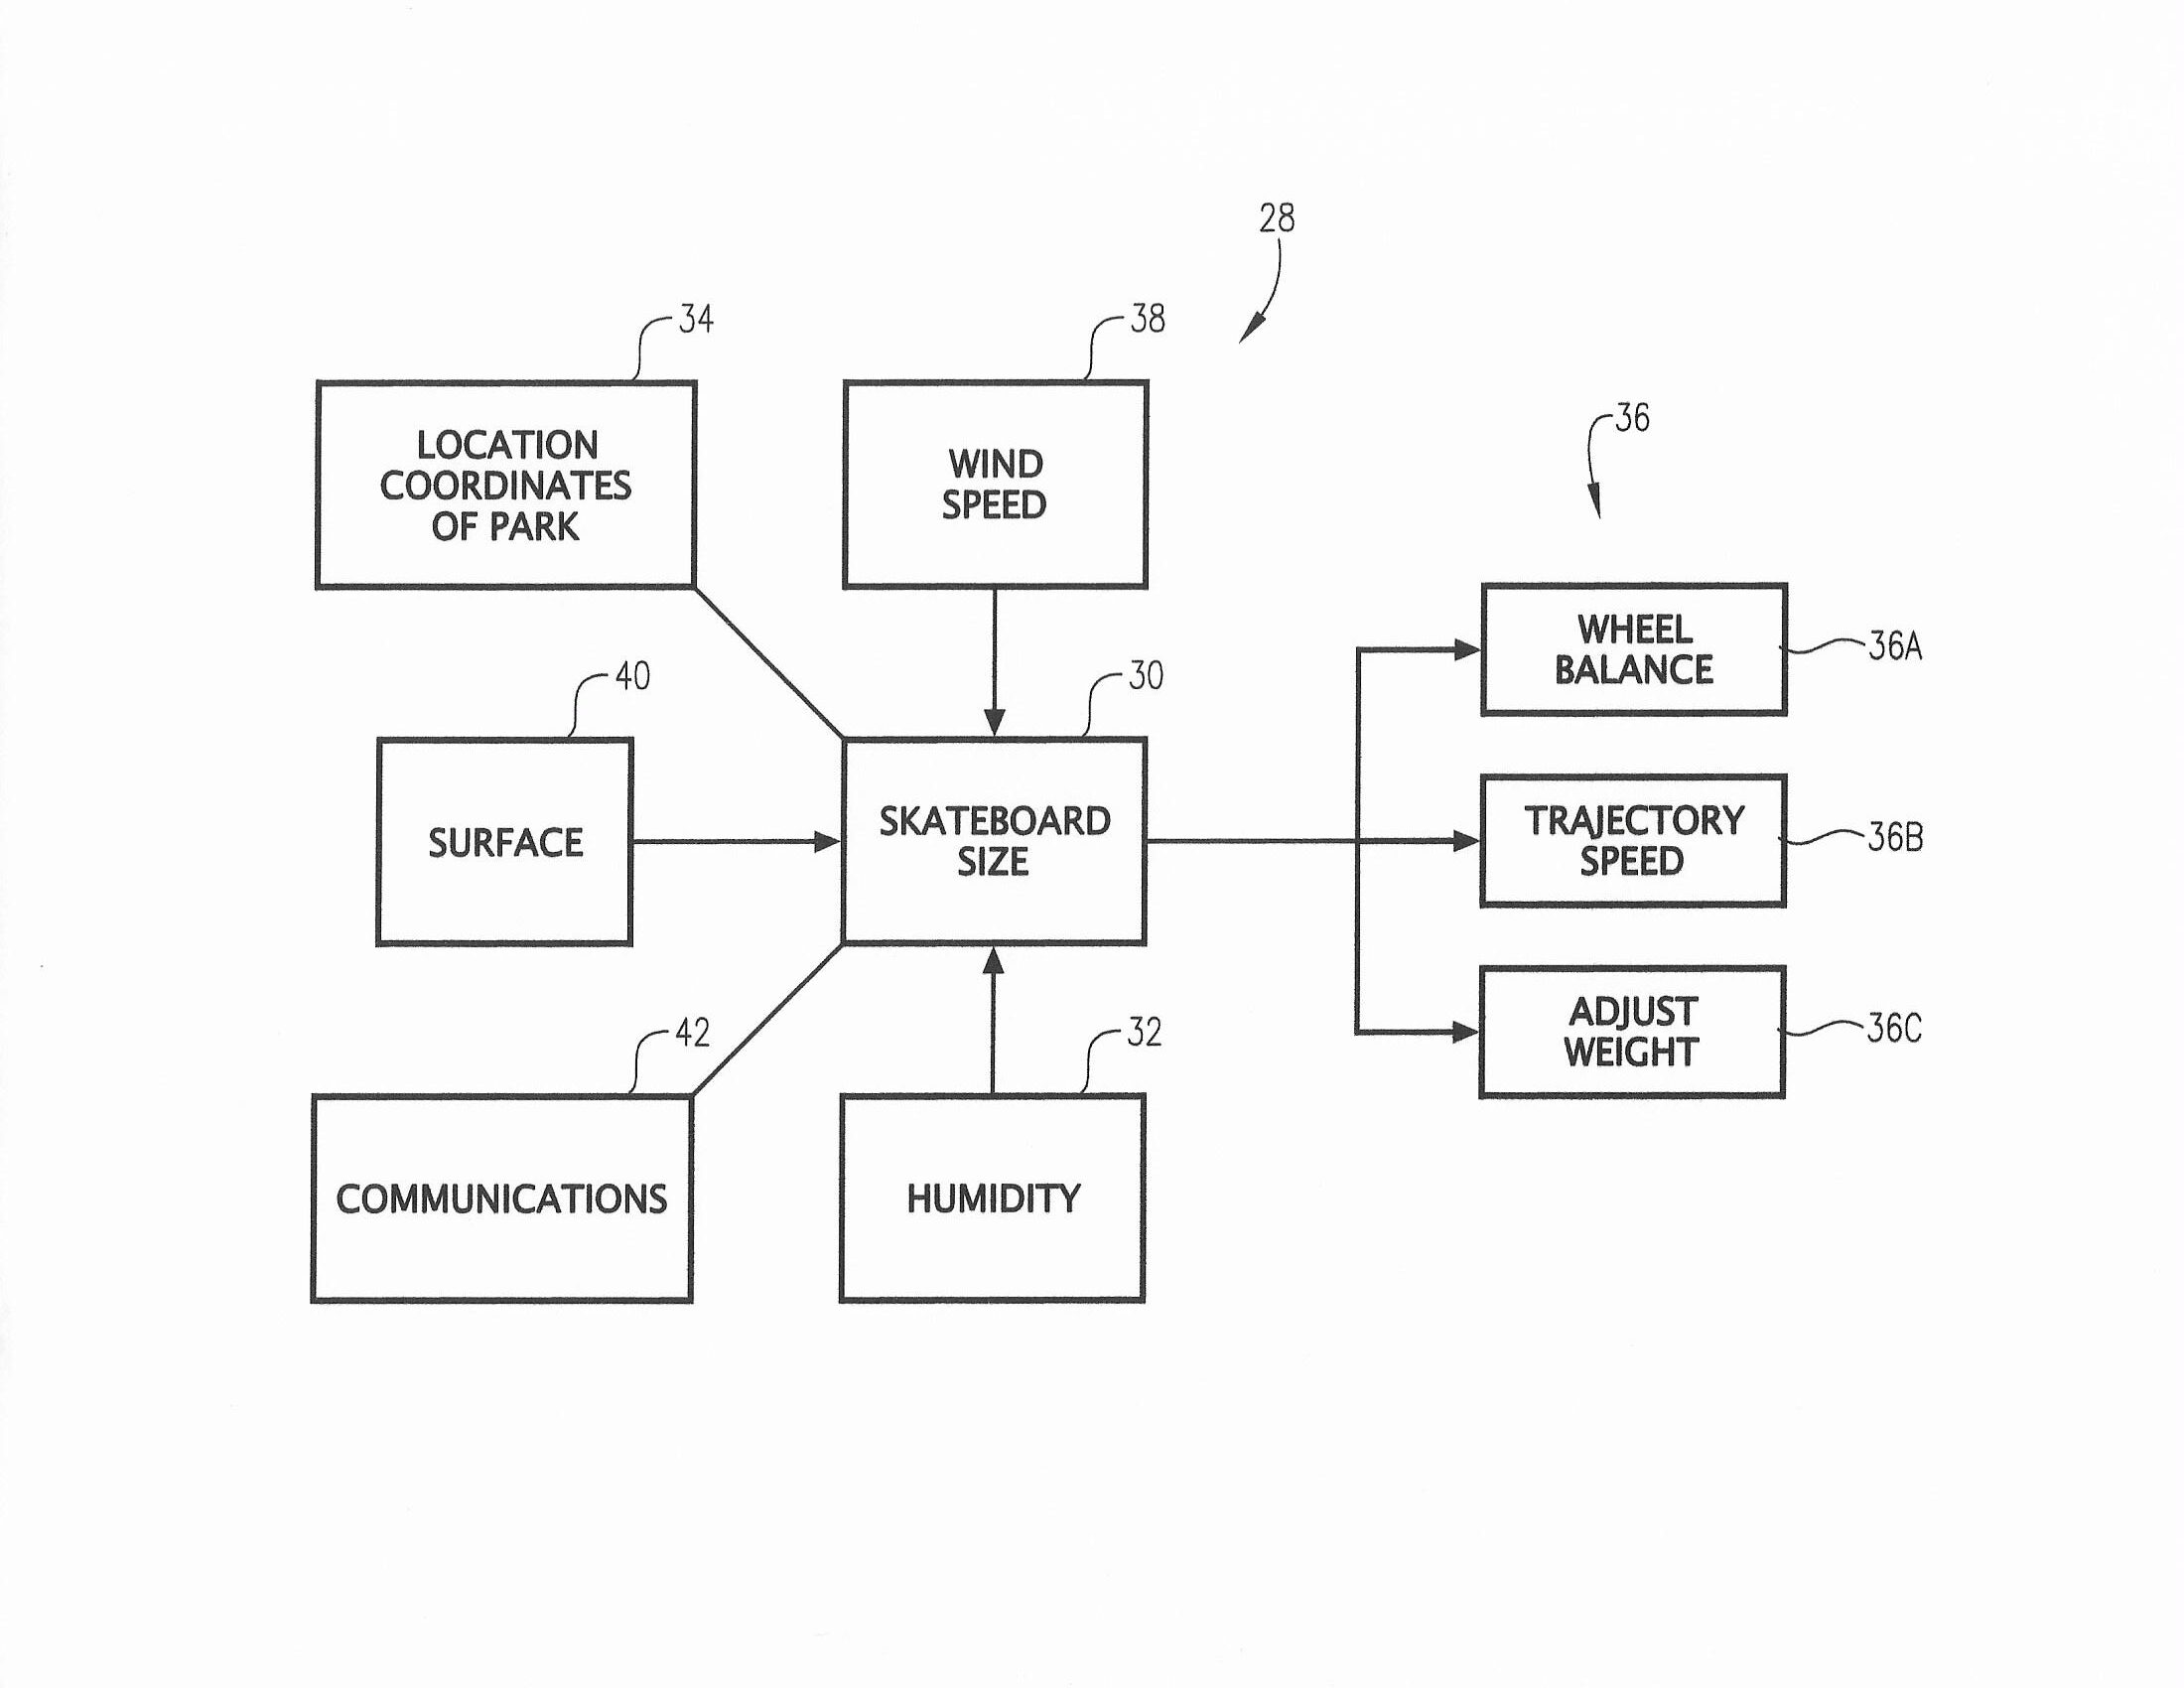
Flow Diagrams
Flow Diagrams show a schematic
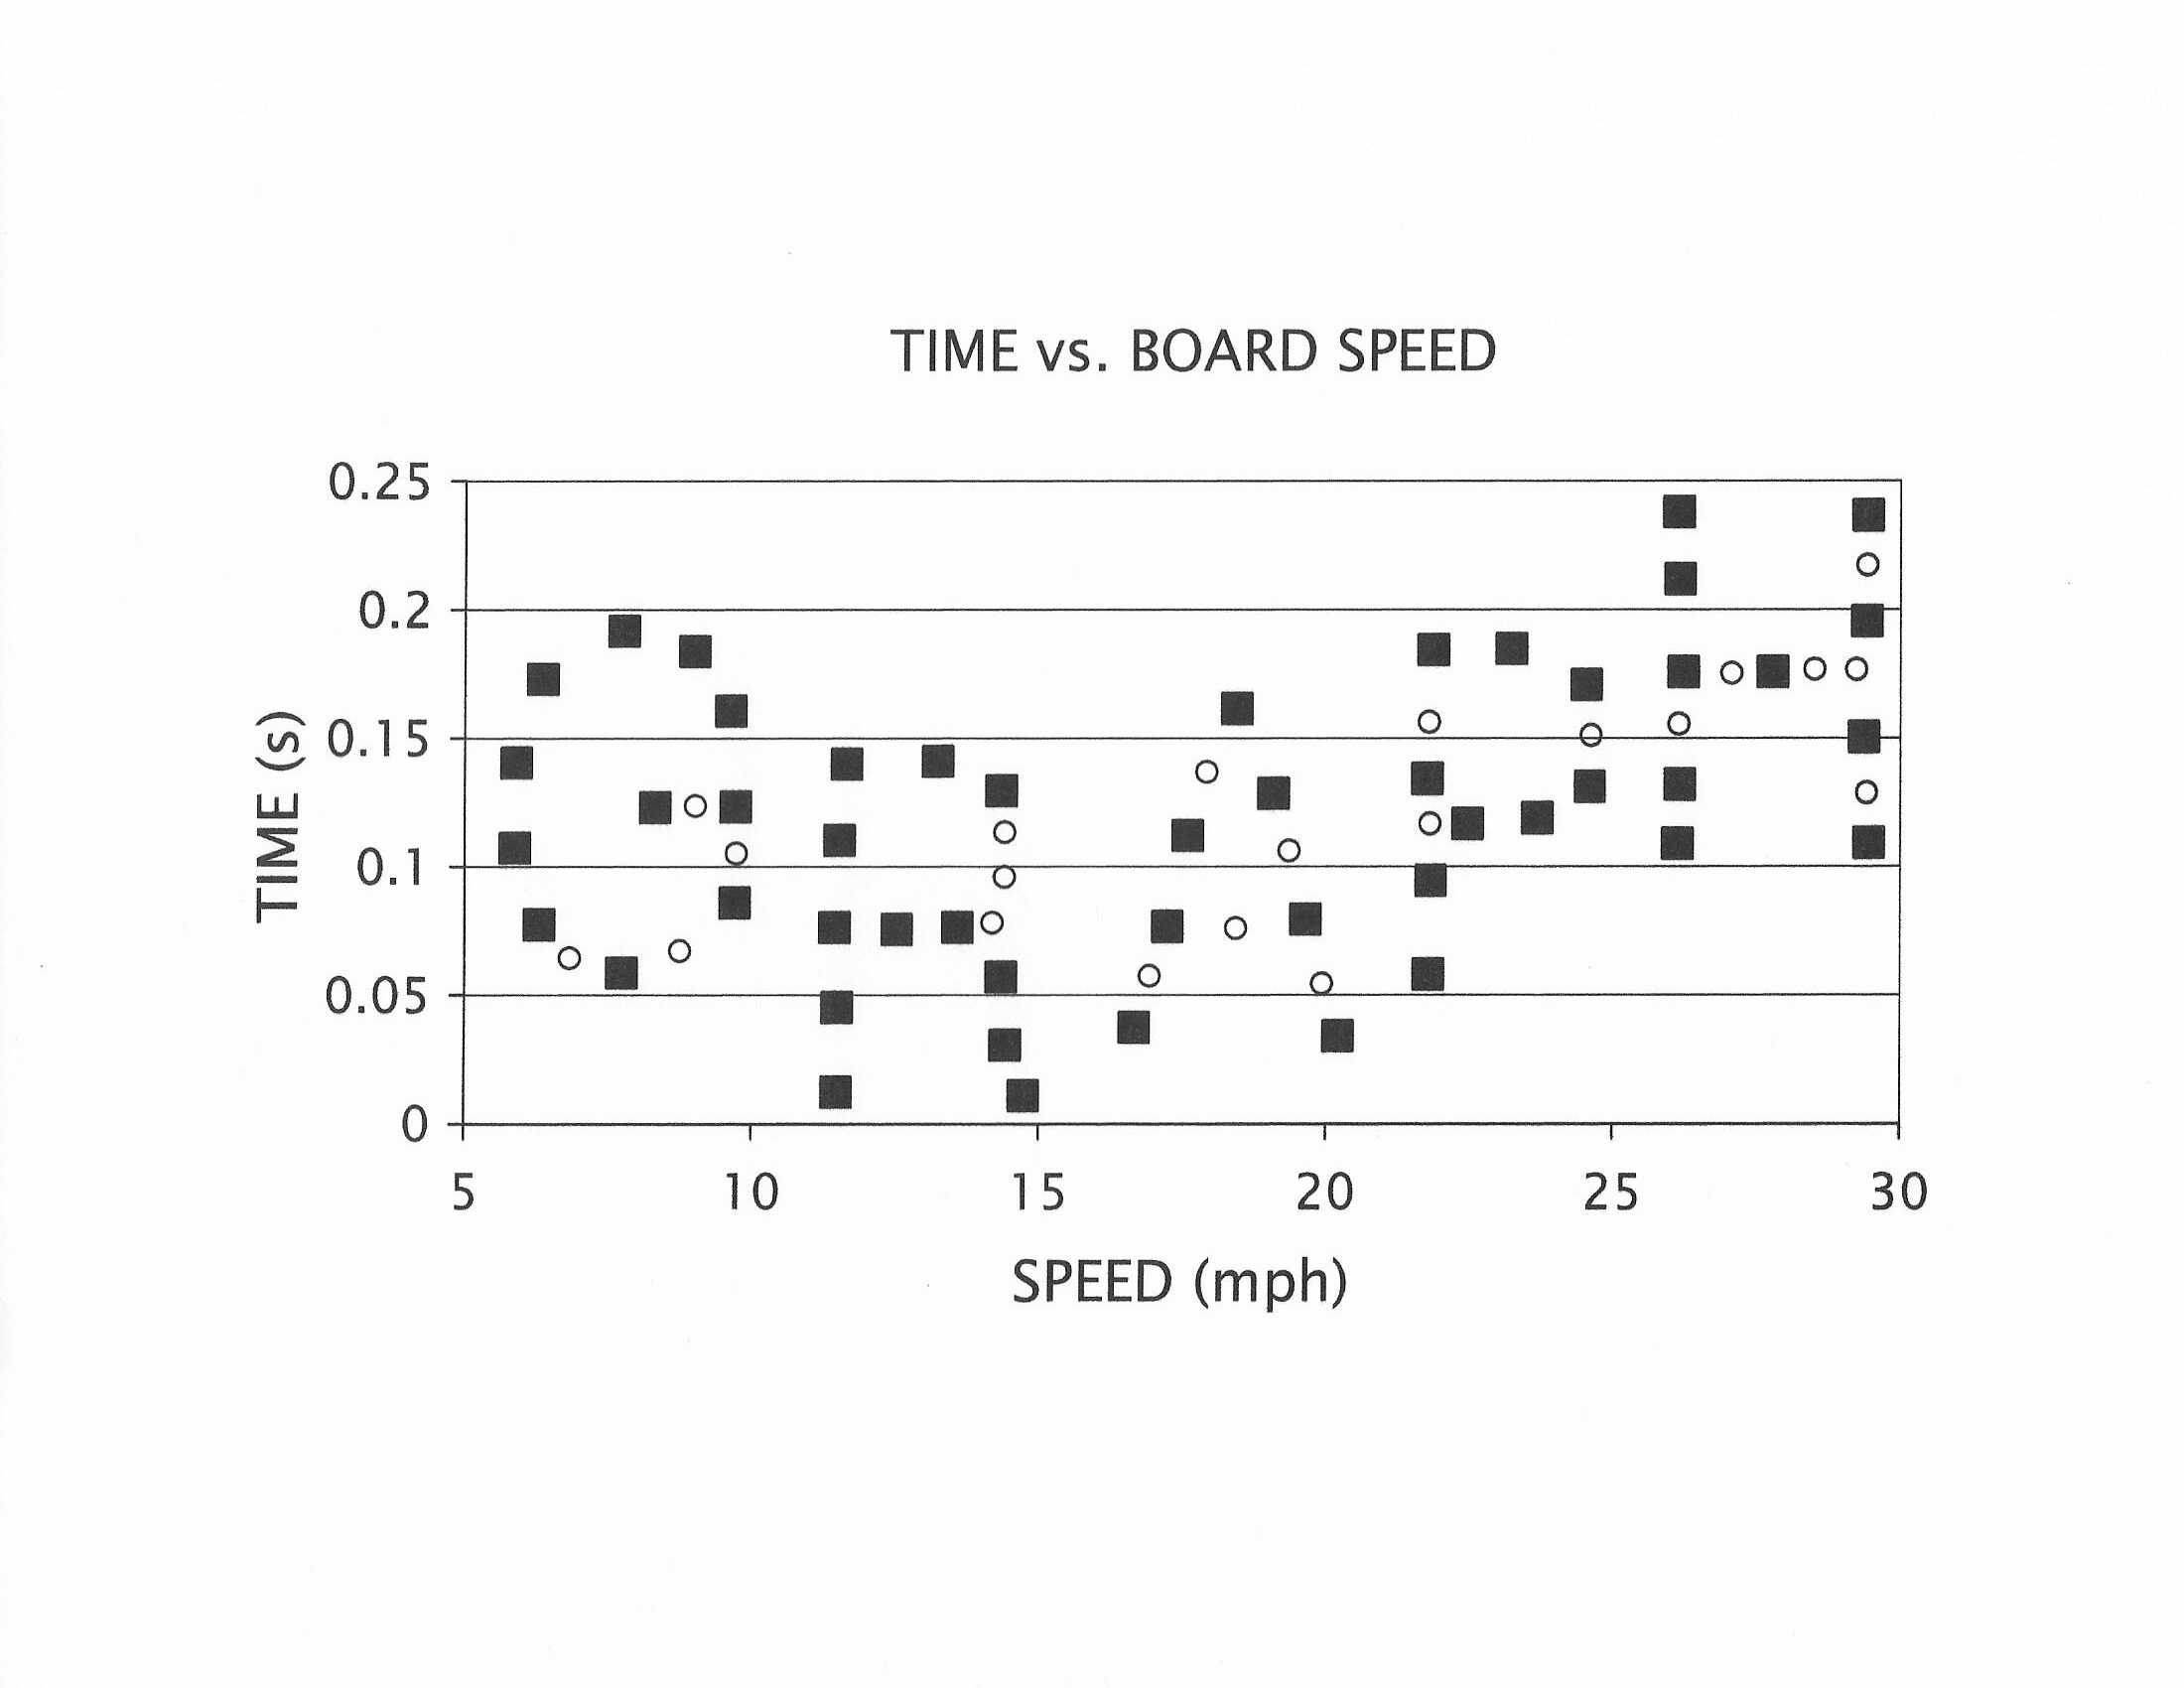
Graphs
Visually organizing x and y values